Excerpt from this week's: Technical Scoop: Precious Record, Cut Question, Booming Commodities
Source: www.stockcharts.com
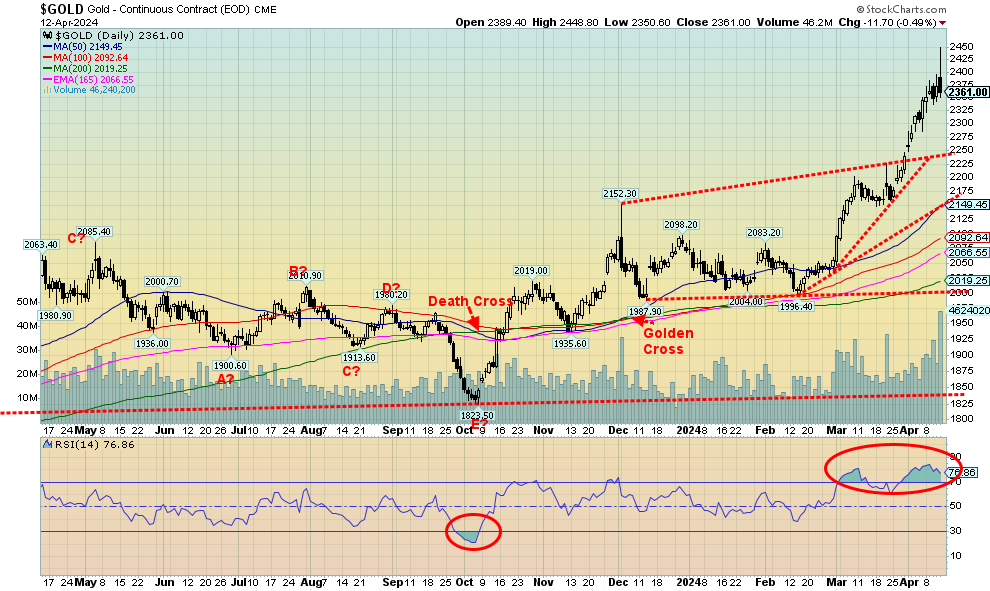
War, or the threat of expansion of the Middle East war helped spark gold to once again reach record prices, falling just short of $2,450 before reversing on Friday and closing lower. Now that there are signs that the Mid-East war is expanding what will be the impact on gold opening Sunday night/Monday Morning. It was a reversal, but not a key reversal as gold prices did not take out the low of the previous day. That suggests a consolidation may lie ahead. While the threat of an imminent attack by Iran on Israel helped spark the initial jump, easing of that fear helped gold reverse. It reminds of us what happened back in December with a comparable spike and reversal. Following that, gold went through a period of consolidation. We may be on the cusp of another consolidation. That would help bring down the severely overbought conditions as measured by the RSI. The commercial COT is a poor 26.6%, well below levels over 30% normally associated with an upward move.
Also not helping gold was a sharp rise in the US$ Index. U.S. treasury bonds, that had been rising in yield, pulled back a bit on Friday as treasury bonds also became a safe haven. One thing for certain is that stocks were not a safe haven as they sold off sharply. Nonetheless, gold was up for the seventh time in the past eight weeks.
On the week, gold rose 1.2% to the new all-time of $2,448.80, silver continued its tear, rising 3.0% to fresh 52-week highs, while platinum woke up, gaining 6.5%. Of the near precious metals, palladium rose 5.2% while copper was up a modest 0.5% and also made 52-week highs. As to the gold stocks, the Gold Bugs Index (HUI) fell 0.8% following that reversal on Friday while the TSX Gold Index (TGD) was up 0.7%.
Gold’s safe-haven status was fully recognized, given the rush into gold this past week. Note how volume leaped. The strong volume on an upward thrust suggests this rally should continue once gold goes through a consolidation period. The threat of expansion of the wars in the Middle East and Russia/Ukraine cannot be easily dismissed. With pressures on currencies, gold becomes a safe haven. Gold even rose, despite the strong performance for the US$ Index.
Many commodity prices have been rising of late. Gold is up 14.6% in 2024, silver up 17.6%, and copper up 9.5%. Platinum remains down 2.1% and palladium has been the weakest, down 7.1%. But other commodities have been rising as well. Other metals are up as well, with aluminum up 4.3%, nickel up 7.4%, while uranium is actually off 2.5% in 2024 but up 368% from the March 2020 lows. The U.S. (and U.K.) have added more sanctions on Russia that now include copper, aluminum, and nickel. Russia will most likely have no problem selling its products elsewhere, but further sanctions could disrupt supply chains, leading to increases as it is prices on the London Metals Exchange (LME) that determines world prices. Russia is a major producer of copper, aluminum, and nickel, holding 4%, 5%, and 6% of the global market, respectively. Russia is also a major gold producer, ranking third in the world behind China and Australia. Canada and the U.S. are ranked fourth and fifth with production levels well below Russia’s.
Gold has been quite overbought, so a period of consolidation would be welcomed to work it off. However, the fear of war in the Middle East is not about to go away. As we noted, we’ve been seeing strong central bank buying of gold, hedge funds are coming back into the market, and Costco’s gold bars have been met with enthusiasm. Eventually that should translate into the gold stocks.
Gold is now through $2,300 and hit over $2,400 suggesting to us that $2,500 is within sight. Technically, gold could fall back towards to $2,175 and remain in an uptrend. However, we would not want to see it break that level. The trend is up and, following a period of consolidation, we should resume that uptrend. With rising volume, we know this a solid uptrend. War, divisive geopolitics, divisive domestic politics, and monstrous global debt are the main drivers.
Source: www.stockcharts.com
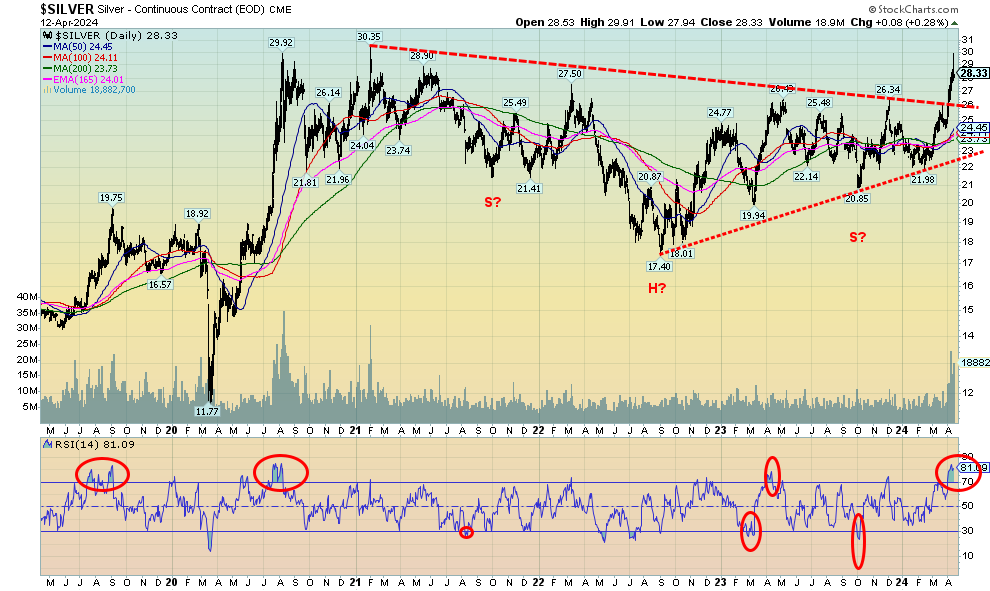
With a close over $28 this past week, silver has now successfully broken out: first over $26, then over $27.50, the early 2022 high. Remaining is a breakout over the February 2021 high of $30.35. The high this past week was $29.91, suggesting we should eventually break out over $30.35. In the interim, it appears we could go through a period of consolidation. The RSI had reached well over 70, overbought territory. Volume was high on the breakout over 27, giving credence and support to the breakout. So, the reversal on Friday should be just that—a reversal, with no lasting negative effects.
On the week, silver gained 3.0% to fresh 52-week highs. Silver outpaced gold once again, lowering the gold/silver ratio to 83.80, well down from the peak of 94.41 seen in February 2024. The all-time high was 131.41 seen in March 2020 at the height of the pandemic. In 2011, at the peak at that time when silver hit near $50, the ratio had fallen to 31.53. To achieve that today silver would have to be $75.
The possible head and shoulders reversal pattern for silver suggests a move to $39/$40. Over $40 targets could as high as $47. The all-time high was $49.82 set in 2011. However, the 1980 high of $49 would require silver to rise to $145 to $165 in order to meet that.
The commercial COT is a poor 27.7% and is not supportive of higher prices. However, we have seen periods where the commercial COT remained low, even as silver prices climbed higher.
Source: www.stockcharts.com
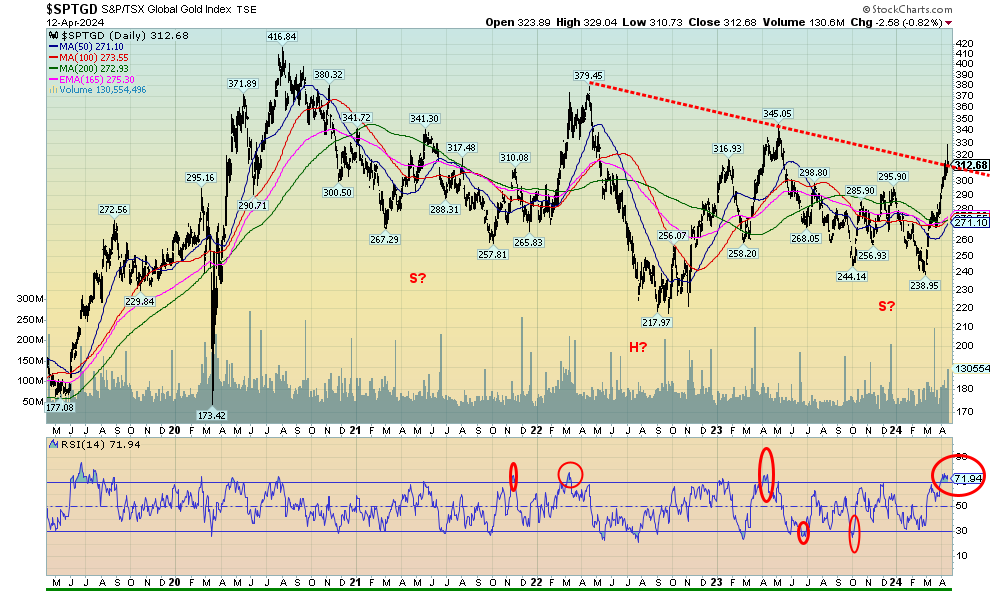
The TSX Gold Index (TGD) broke out this past week. Or did it? Based off the early 2022 high, the TGD broke out, hitting a high of 329 before selling off on profit-taking and a general reversal in the market. The TGD then fell right back to the breakout line near 310. Based off the August 2020 high, the TGD still needs to break out over 340.
On the week, the TGD managed to rise 0.7%, despite Friday’s sharp reversal. The HUI actually fell 0.8% on the week. The HUI did break out when it cleared 240, but it still needs to clear above 300 to suggest higher prices. Despite the reversals on Friday for both the TGD and HUI, all it looks like is a reversal day and not the end of a rally. A period of consolidation is not out of the question, given the RSI climbed into overbought territory above 70.
The Gold Miners Bullish Percent Index (BPGDM) reached 78.57 this past week, putting the index above 75 in overbought territory. Still, the index has room to move higher. In 2020 it hit 100, the highest level seen since the index was started in 2007. There is no guarantee the TGD can go higher, as failures once over 75 for the BPGDM were seen in 2022. Since 2020, both the TGD and the HUI have underperformed for both gold and silver. The Gold/HUI ratio and the Gold/TGD ratio show that the gold stocks remain very cheap vis-à-vis gold.
The TGD has a potentially compelling head and shoulders pattern on the charts. It’s quite imperfect, given that the right shoulder is supposed to remain above the left shoulder. Nonetheless, the shape is there. Friday’s breakout appeared to suggest that the H&S pattern was being broken. Then it failed. If the pattern is correct, then the TGD has potential targets up to 470. At that level, the TGD would be recording new all-time highs. The TGD remains down 31% from its all-time set in 2011. The HUI is worse, down 59% from its all-time high. Those highs seem but a distant memory. The gold stocks, despite gold making all-time highs, have remained quite depressed, unnoticed, and unloved. Instead, the flavour of the day has been cryptos and AI stocks. But if the gold stocks catch people’s attention, it’s a small market and prices could move up quickly. As to the H&S pattern, if the 2020 high is used instead, then once over 340 (the neckline) potential targets are up to 540.
The breakout this past week was encouraging. However, the sharp reversal on Friday suggests we could consolidate first. Only a break back under 270 could end the current rally.
Read the full report: Technical Scoop: Precious Record, Cut Question, Booming Commodities
Disclaimer
David Chapman is not a registered advisory service and is not an exempt market dealer (EMD) nor a licensed financial advisor. He does not and cannot give individualised market advice. David Chapman has worked in the financial industry for over 40 years including large financial corporations, banks, and investment dealers. The information in this newsletter is intended only for informational and educational purposes. It should not be construed as an offer, a solicitation of an offer or sale of any security. Every effort is made to provide accurate and complete information. However, we cannot guarantee that there will be no errors. We make no claims, promises or guarantees about the accuracy, completeness, or adequacy of the contents of this commentary and expressly disclaim liability for errors and omissions in the contents of this commentary. David Chapman will always use his best efforts to ensure the accuracy and timeliness of all information. The reader assumes all risk when trading in securities and David Chapman advises consulting a licensed professional financial advisor or portfolio manager such as Enriched Investing Incorporated before proceeding with any trade or idea presented in this newsletter. David Chapman may own shares in companies mentioned in this newsletter. Before making an investment, prospective investors should review each security’s offering documents which summarize the objectives, fees, expenses and associated risks. David Chapman shares his ideas and opinions for informational and educational purposes only and expects the reader to perform due diligence before considering a position in any security. That includes consulting with your own licensed professional financial advisor such as Enriched Investing Incorporated. Performance is not guaranteed, values change frequently, and past performance may not be repeated.
About the author


Website: https://www.enrichedinvesting.com
Disclaimer: David Chapman is not a registered advisory service and is not an exempt market dealer (EMD) nor a licensed financial advisor. We do not and cannot give individualised market advice. David Chapman has worked in the financial industry for over 40 years including large financial corporations, banks, and investment dealers. The information in this newsletter is intended only for informational and educational purposes. It should not be considered a solicitation of an offer or sale of any security. The reader assumes all risk when trading in securities and David Chapman advises consulting a licensed professional financial advisor before proceeding with any trade or idea presented in this newsletter. David Chapman may own shares in companies mentioned in this newsletter. We share our ideas and opinions for informational and educational purposes only and expect the reader to perform due diligence before considering a position in any security. That includes consulting with your own licensed professional financial advisor.