Excerpt from this week's: Technical Scoop: Fight Fear, Precious Highs, Monetary Expansion
Gold 1999–2024
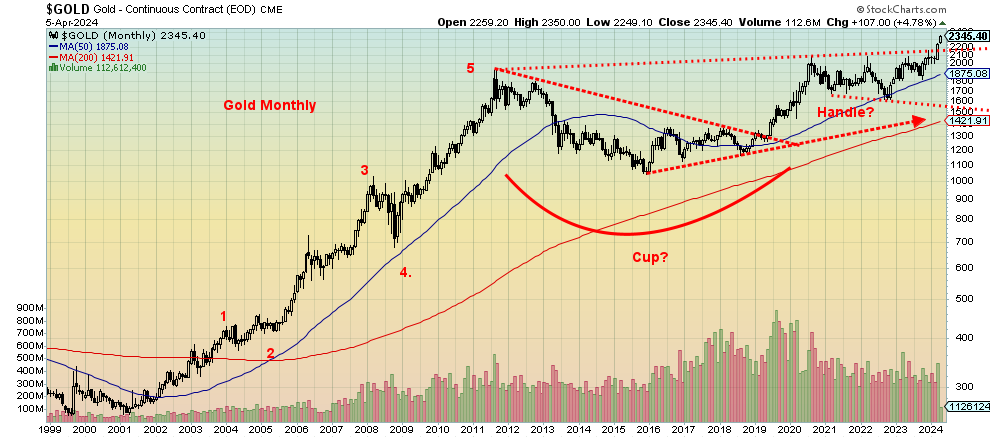
Source: www.stockcharts.com
Our long-term chart of gold suggests it is making a major breakout from what appears as a cup and handle pattern. The cup was formed during the long period from 2011 to 2020. Gold rose sharply out of the pandemic low in March 2020. However, since then it has been in a downward/sideways pattern, forming what we believe is the handle of the pattern. With its breakout above $2,200 it appears to be busting above the handle. If that is correct, the pattern suggests that gold could have targets up to $3,050 zone with potential minimum objectives to $2,375/$2,385. Gold is now crossing over $2,300 (June futures front month).
We have a similar pattern on silver, only the pattern is more massive and dates from the highs of 1980. The cup was the long period between 1980 and roughly 2006 when silver broke above earlier highs. The second peak in 2011 at roughly the same level as 1980 started the formation on what appears as the handle and projects silver to potentially rise to about $75 once we clear above $27.50. Minimum potential targets appear to be $38/$40. Could it all be a false breakout? Possibly but the fundamentals behind it are strong so a false breakout is unlikely.
These are significant breakouts and they do come after what we believe were important cycle lows for both gold and silver. Gold made its 7.8-year cycle low and possibly the 23.5-year cycle low in November 2016. Silver made what may be an important half-cycle low to the 18.5-year cycle in March 2020. We are now going into the second half of that cycle and it is potentially the most explosive.
Silver 1970–2024
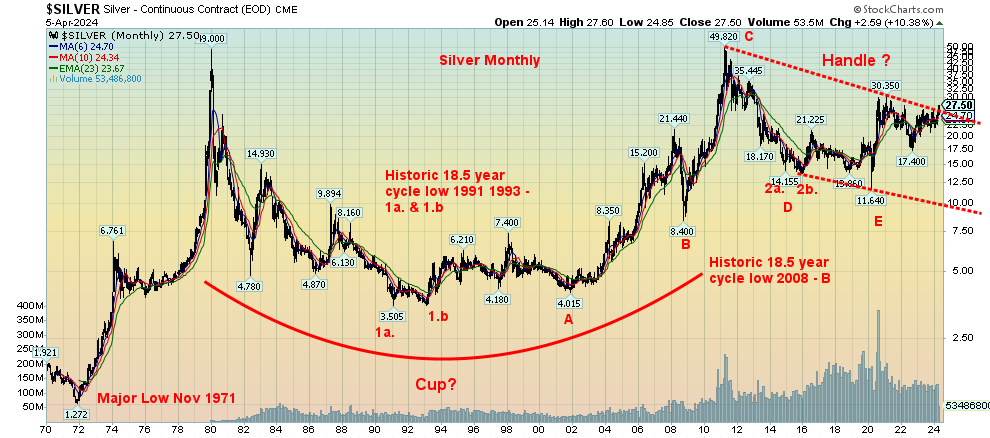
Source: www.stockcharts.com
Oil is also poised to go higher, possibly substantially. The Russia/Ukraine war sparked a breakout. The correction that has been going on for months now has only been testing that original breakout line. The March 2020 pandemic low was an important cyclical low, possibly a 9-year–half-cycle low to the longer 18-year cycle. If that’s correct, then we are in the second phase and that is usually the most explosive. That March 2020 low did come almost 12 years after the 2008 low but remained within range 7–11 years, although just barely.
Fear and consequence can be important drivers for both gold and oil. War or just the threat of it is the fear. Gold is responding to the fear. The consequence is a potential sharp rise in the price of oil where drivers will eventually feel it at the pump. As we have said so many times, the gold market is small so even a small re-allocation of funds to the sector can move prices very quickly.
Read the entire report: Technical Scoop: Fight Fear, Precious Highs, Monetary Expansion
About the author


Website: https://www.enrichedinvesting.com
Disclaimer: David Chapman is not a registered advisory service and is not an exempt market dealer (EMD) nor a licensed financial advisor. We do not and cannot give individualised market advice. David Chapman has worked in the financial industry for over 40 years including large financial corporations, banks, and investment dealers. The information in this newsletter is intended only for informational and educational purposes. It should not be considered a solicitation of an offer or sale of any security. The reader assumes all risk when trading in securities and David Chapman advises consulting a licensed professional financial advisor before proceeding with any trade or idea presented in this newsletter. David Chapman may own shares in companies mentioned in this newsletter. We share our ideas and opinions for informational and educational purposes only and expect the reader to perform due diligence before considering a position in any security. That includes consulting with your own licensed professional financial advisor.